Using Cursor to navigate distributed system architecture
February 2026 · Tomasz Borys
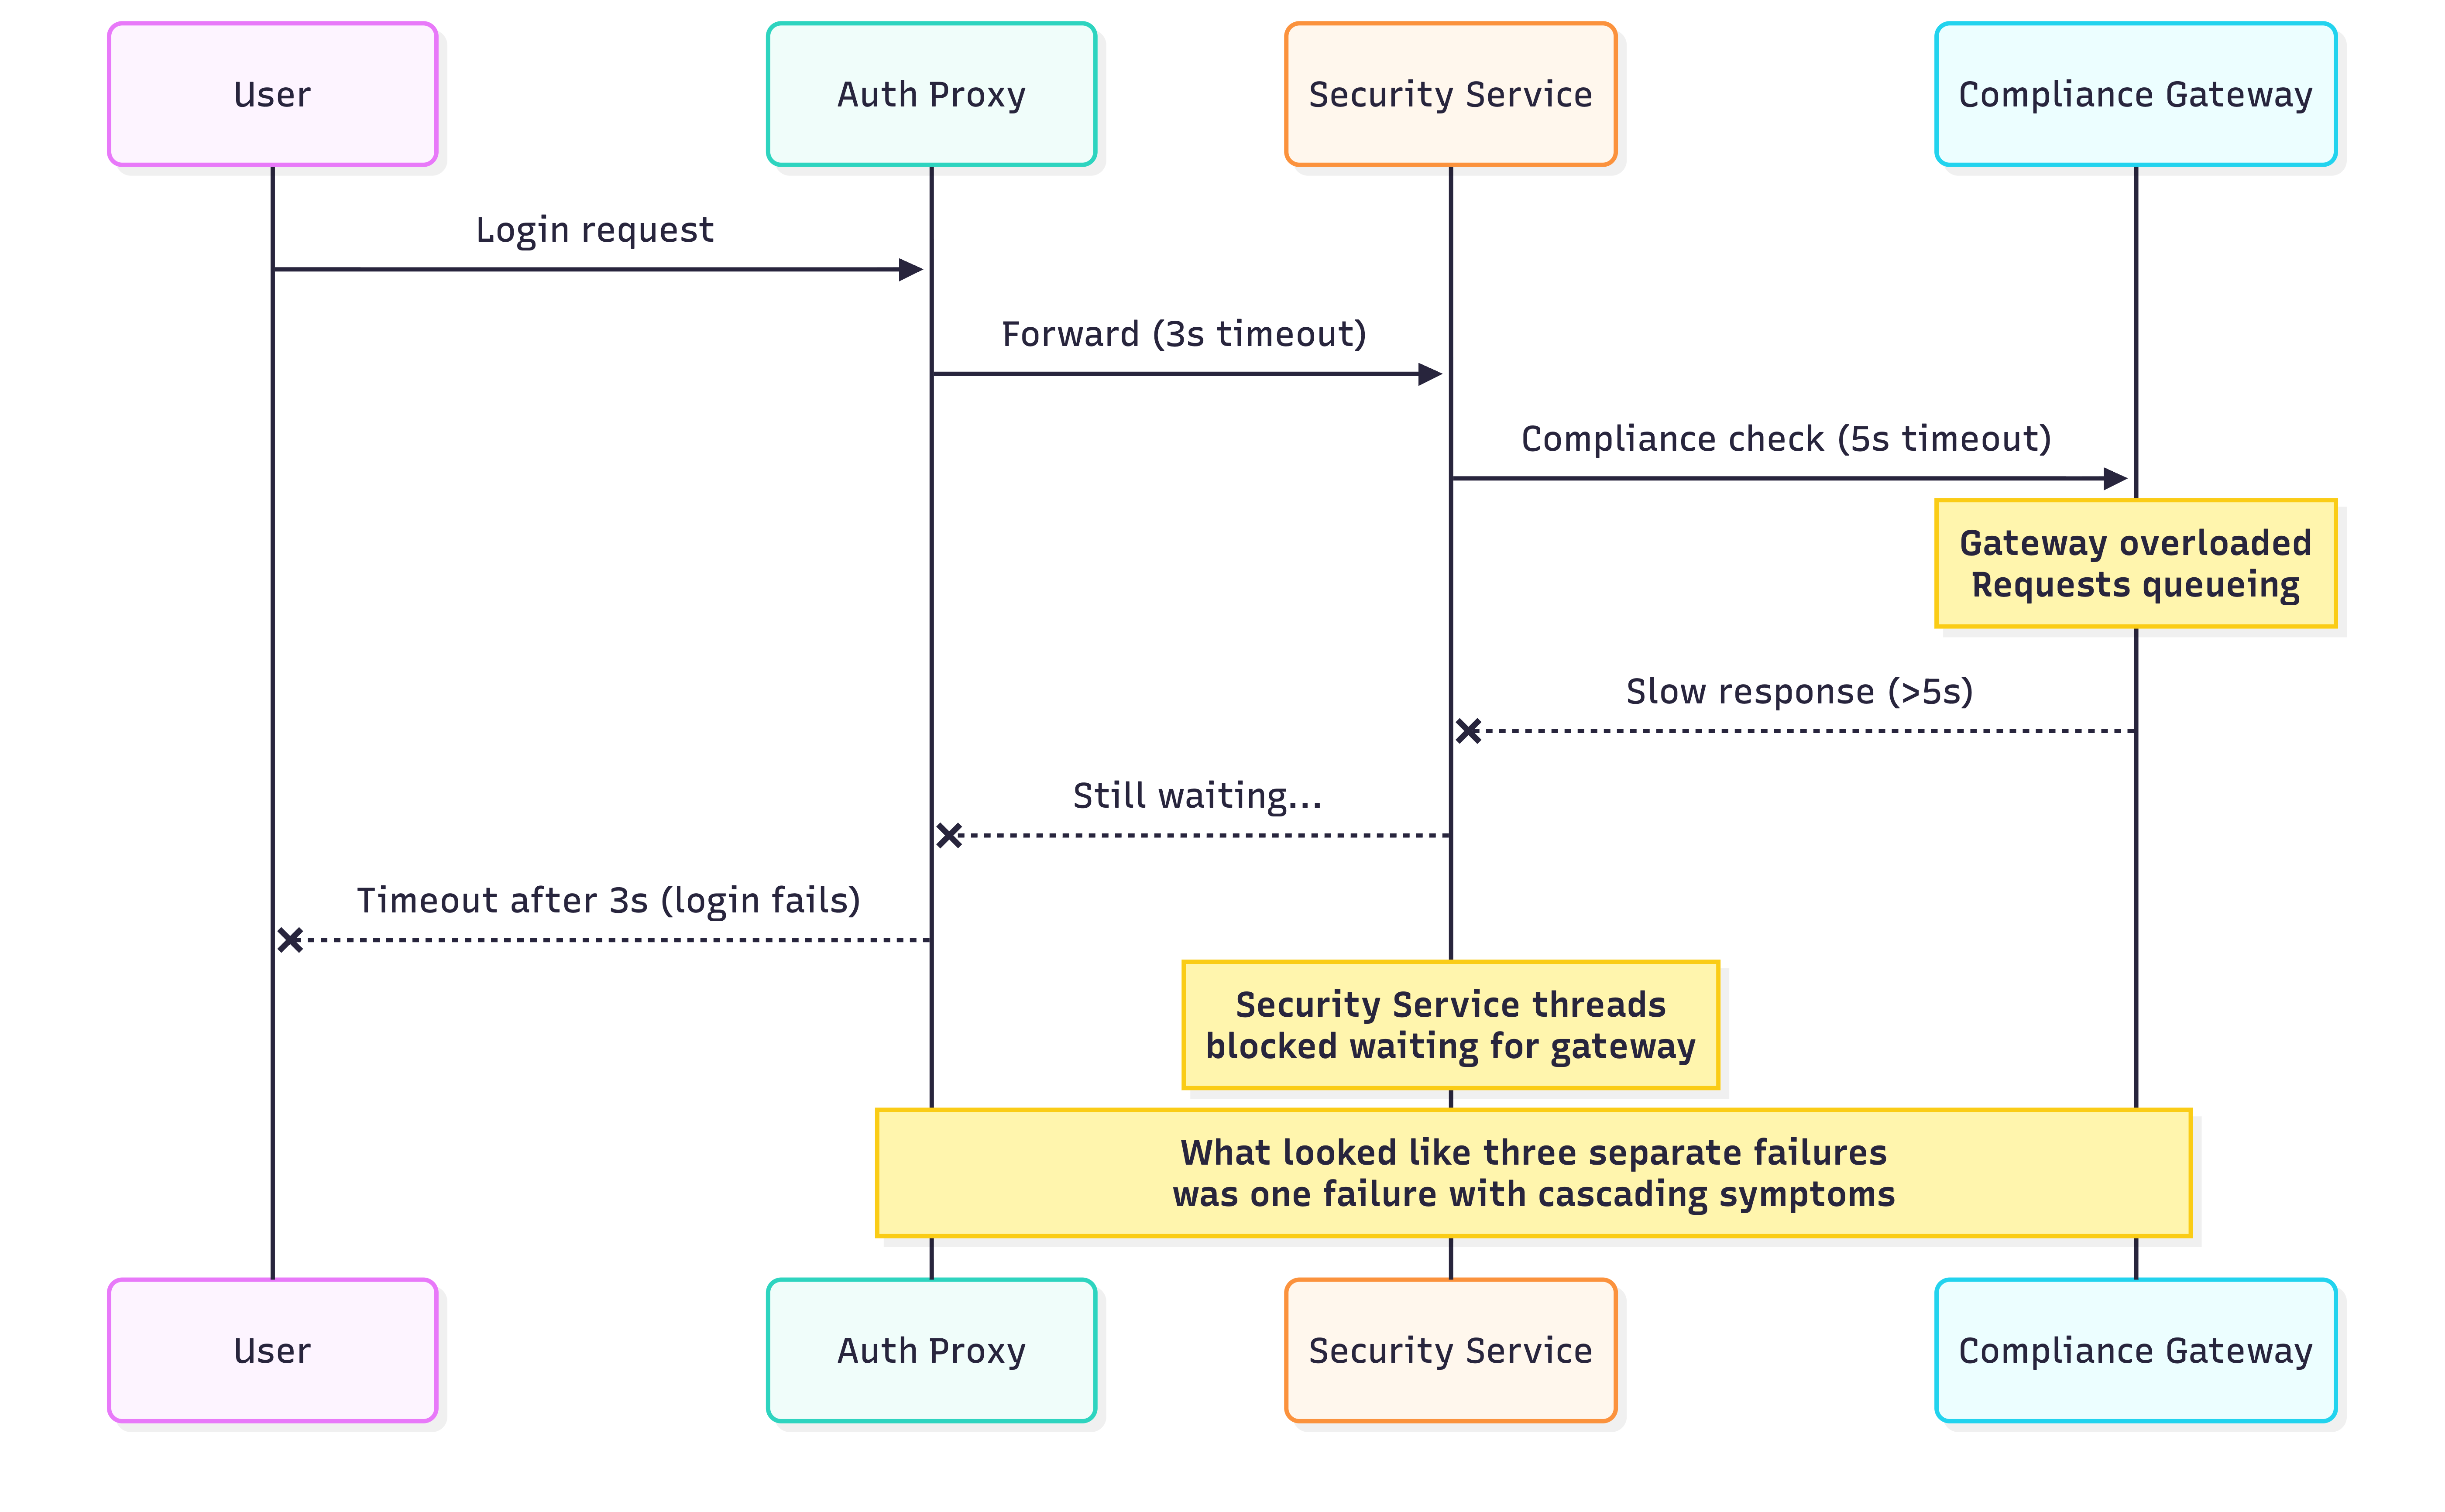
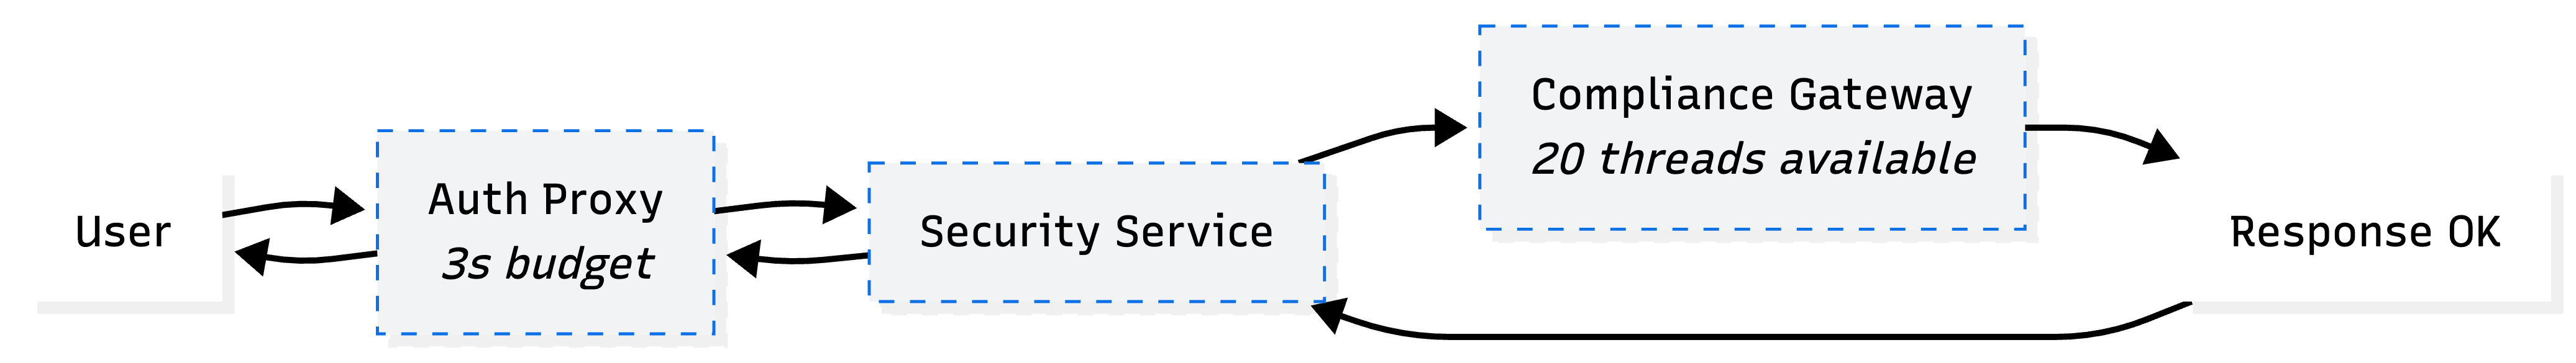
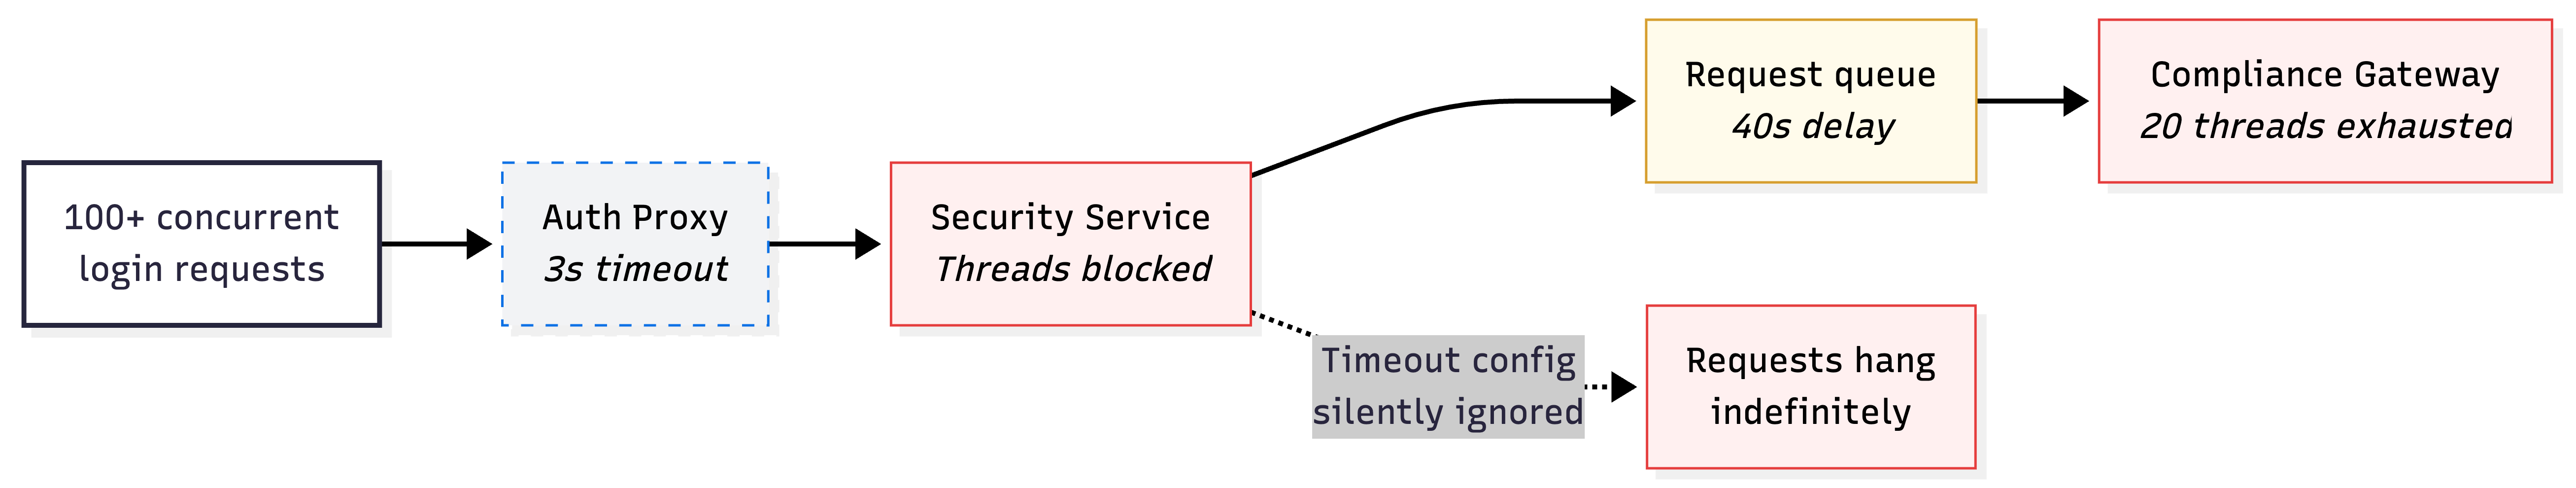
Last year we had login failures during a traffic spike. Several services were involved, each owned by a different team. One service timed out before another could complete its checks. A downstream gateway could not handle the load, causing requests to queue. A 40 second delay that looked like a separate issue turned out to be a symptom of the gateway bottleneck.
The problem was not in any single service. It was in the space between them. Timing, capacity and ownership boundaries that no individual codebase could explain.
I opened Cursor with a multi root workspace. Frontend repo, several backend services, deployment configs. I asked it to trace the relationships. It found the API contracts and service references across repos. Technically correct results. But it could not show the runtime path, the capacity constraints or the fact that the apparent third issue was a side effect of the first.
That moment clarified something. The tool was working. The problem was not the tool. The problem was that architectural understanding in distributed systems lives in places code alone cannot reach.
This is the world most of us ship in.
Why architectural knowledge is unreliable
In distributed systems, whether microservices, micro frontends or multiple platforms, the sources you depend on for understanding tend to drift from reality.
Service contracts and deployment configs describe what was intended, not what is running. An OpenAPI spec written six months ago may describe an interface that has since changed. An API contract defined once gets consumed differently by iOS, Android and web clients. Event schemas drift between producers and consumers. Kubernetes manifests describe a desired state, but the actual topology lives in runtime behaviour.
Documentation ages quickly. It is usually written at the point of highest understanding and lowest urgency. By the time someone needs it, it reflects a system that no longer exists in quite the same form.
Observability tools capture what happened, not why (at least not always). Traces show call paths. Metrics show trends. Neither shows the reasoning behind an architectural boundary or the ownership decisions that created it.
People hold the rest. Often siloed by team, sometimes by tenure. When someone leaves, their knowledge does not get committed to a repo.
The cognitive load is real. Engineers spend significant time reconstructing context that spans multiple repos. What calls this service? What happens if I change this contract? Who owns the thing that breaks? These are coordination questions with code level symptoms.
What Cursor actually revealed
Using Cursor across these boundaries did not solve the architectural problem. It made it more visible.
Cursor could index the codebase and answer "where is this endpoint called?" with results spanning multiple repositories. But it could not show that one service's timeout was shorter than another's processing time. It could not show that the gateway was a shared bottleneck under load. It could not explain that what looked like multiple separate failures was actually one failure with cascading symptoms.
From code alone, that was the limit. But the investigation did not stop there.
I started pulling traces from our observability platform. Screenshots of call paths, timeout sequences, request queuing patterns. Colleagues from different teams contributed their own insights, explaining service behaviour that only made sense with their domain knowledge. I pasted the runtime evidence into the conversation alongside the code Cursor had already indexed. The shift was immediate. With that context in front of it, the model could reason about the timeout chain. It connected the gateway bottleneck to the cascading failures and started suggesting targeted fixes.
The interesting part was what happened next. The more context I fed in, the more accurate the suggestions became. At one point it surfaced a ripple effect I had not considered: a timeout configuration that was silently ignored, meaning requests to a downstream service could hang indefinitely instead of failing fast. That silent failure was causing threads to block, which starved the entire login flow under load. That led to a fix I would have found eventually, but not as quickly.
But I had to know where to look in our monitoring tools. I had to know how to read the traces, which services to connect in the workspace and what to ask the teams who owned them. The tool did not generate understanding. It amplified understanding I was already building through the investigation. I have written before about how AI amplifies the signal that deep, focused thinking creates. This investigation was a clear example of that.
An important distinction: the reasoning came from the LLM, not from Cursor itself. Cursor provides a well designed interface for working across repos. But the quality of reasoning depends on which model you select.
At the time of writing, I use different models for different tasks. A stronger reasoning model for planning and investigation, a faster code focused model for implementation and I switch again for debugging. The specific models change frequently. The habit of choosing deliberately does not.
One technique that proved especially useful during this investigation was asking the model to ask me questions. Rather than just feeding it data and expecting answers, I asked it to challenge my understanding of the system. It surfaced blind spots I would have otherwise missed.
What Cursor does well is reduce the friction of cross repo navigation. Multi root workspaces, semantic search across boundaries, the ability to ask a question and get answers from multiple codebases at once. That is genuinely useful. It shortens the path to understanding service relationships, identifies blast radius before shipping and helps engineers build context faster.
But the quality of what you get out is directly linked to the quality of what you put in. When the input is code alone, you get code level answers. When you bring runtime evidence into the conversation, the reasoning deepens. The tool scales with your understanding of the system, not the other way around.
Conway's Law shows up in your tooling
There is a useful audit you can do with any cross cutting question.
Map which repos you need to open to answer it. That map is your actual architecture. Not the diagram on the wiki, not the boxes in the slide deck. The repos you actually had to read.
If answering "what happens when a user logs in?" requires opening five repos across three teams, that is not a tooling problem. That is an organisational design choice with architectural consequences. Conway's Law is not theoretical. It is the handful of pull requests across separate repos needed to ship one feature. It is the group chat where three teams align on a contract change. It is the incident where no single team has the full picture.
Cursor makes this mapping faster but it does not change the shape. If the repos are fragmented, the search results will be fragmented. If ownership is unclear, the answers will be unclear. The tool mirrors the organisation.
This is worth paying attention to. The friction you feel when navigating a distributed system is often signal about how the organisation is structured, not about the tools you are using.
Try this with your own system
If any of this resonates, there is a practical way to test it.
- Pick one user facing flow that spans multiple services
- Open a multi root workspace with the repos involved
- Ask: "If I change this contract, what breaks?"
- Note what you cannot answer from code alone, that is your visibility gap
- Map which repos you needed to open, that map is your actual architecture
- Compare that map to your architecture diagram. If they differ, the diagram is wrong
- If the diagram is wrong, ask who last updated it and why they stopped
The point is not to find fault with your system. Every distributed architecture has gaps between what is documented and what is real. The point is to make those gaps visible so you can decide which ones matter.
Closing reflection
The question is not whether Cursor or any tool solves architectural complexity across many repos.
The question is what that struggle tells you about how your system is actually organised.
If architectural understanding is scattered across teams, repos and runtime behaviour, no tool will make that disappear. But a tool that makes the friction visible might be the first step toward better design.
The current generation of coding agents tends to work best inside single, well structured repos. In distributed systems the agent is only as good as the architectural visibility you give it, the contracts and interfaces it can discover and the context you maintain across repo boundaries. That is primarily a coordination problem with code level symptoms.
After the incident I documented the investigation, created diagrams showing the service relationships and failure paths and shared the findings across the teams involved. Even if the system changes, there is now a record of what happened, how it was fixed and what to look for if something similar occurs. That kind of work is easy to skip when the pressure is off. It is also where most architectural knowledge gets lost.
Understanding your system is part of the work. Tools that reduce the friction of understanding are valuable. But they do not replace the discipline of making connections explicit, through contracts, through documentation, through observability and through conversations that cross team boundaries.
If you are dealing with this kind of problem or have found approaches that work, I would like to hear about it. I am planning to write more on this topic.